

omniIQSee what’s happening. Act while it matters.
Give your team a clear view of contact centre performance. omniIQ turns live Amazon Connect data into easy-to-understand dashboards, wallboards and alerts.
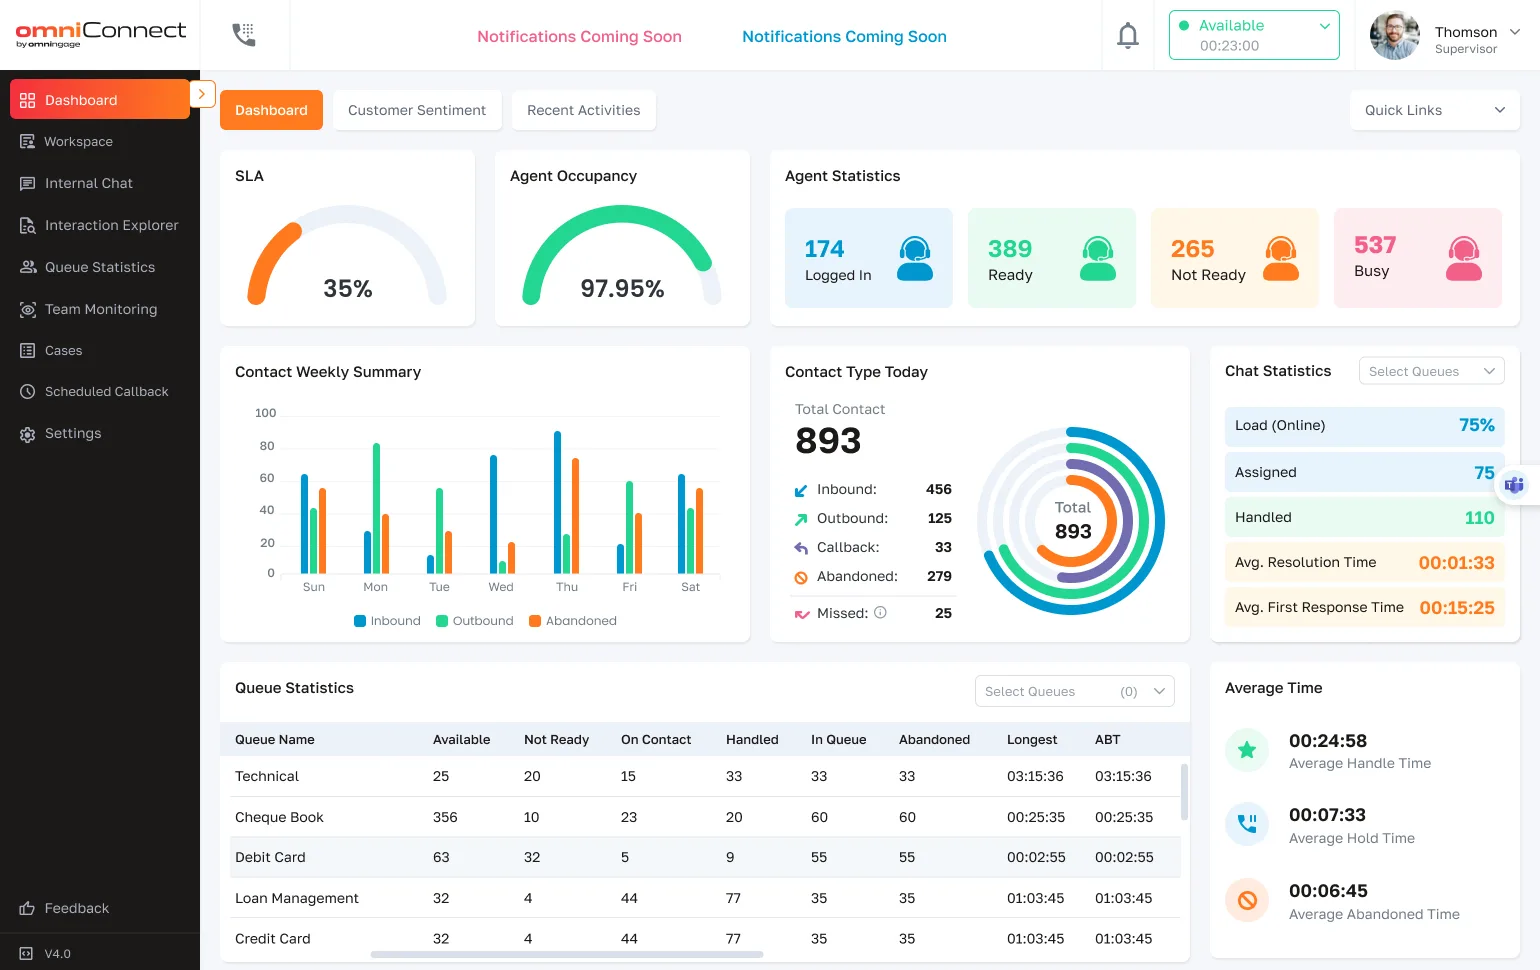
Give your team a clear view of contact centre performance. omniIQ turns live Amazon Connect data into easy-to-understand dashboards, wallboards and alerts.

Bring key performance information into one clear view, helping teams understand where attention is needed.
Use configurable widgets and a drag-and-drop designer to create views for different teams, queues and audiences.
Set thresholds and visual indicators that highlight when performance moves outside your expectations.
Configurable email and SMS alerts help the right people respond without constantly watching a dashboard.
Share dashboards through approved browsers and wallboards, giving office-based, hybrid and remote teams a consistent operational view. Display targeted messages and updates alongside performance information to keep everyone informed.
Less manual checking. Faster decisions. Clearer operational priorities.
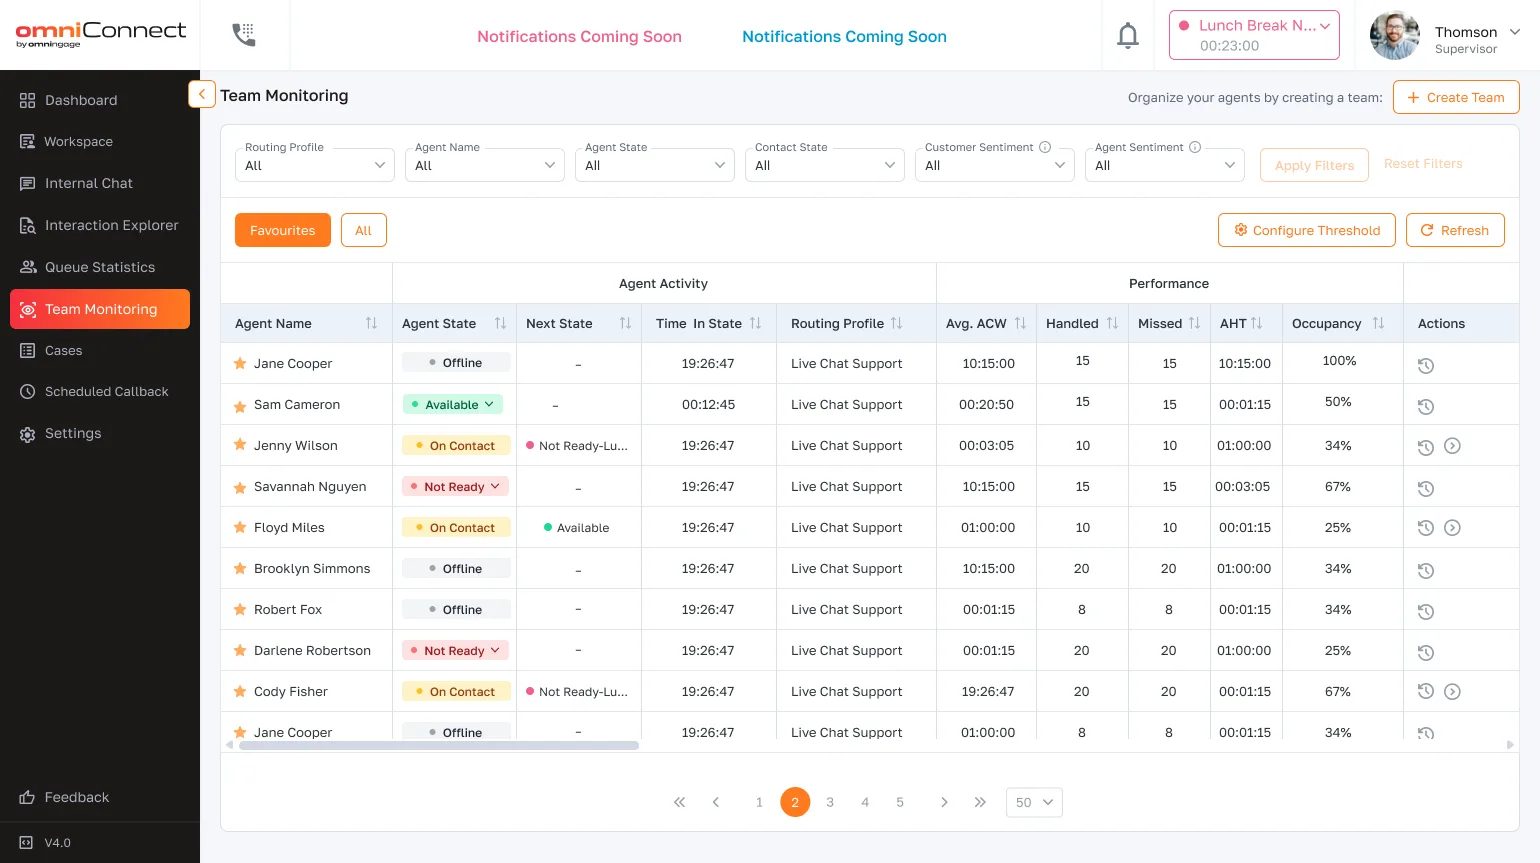
Live dashboards help you respond now. Add omniIQ Reporting for historical reports and analysis that help you understand trends and plan improvements.
Show us what your team needs to see. We’ll demonstrate how omniIQ can bring it into focus.
